Praise, Protein, & Predictions
Introduction
Food.com is one of the largest repositories of community-contributed recipes and reviews on the internet. This analysis examines a comprehensive dataset extracted from the website, encompassing recipe submissions and user interactions from 2008 onwards. The dataset provides detailed information about recipes, including preparation methods, nutritional content, and user-generated reviews, making it a valuable resource for understanding cooking trends and user preferences in online culinary communities. By combining recipe attributes with user feedback, we can explore the relationships between recipe characteristics, such as preparation complexity and nutritional content, and user satisfaction as expressed through ratings and reviews.
File Description 'RAW_recipes.csv'Details about the recipes (name, contributor, nutrition info, etc.) 'RAW_interactions.csv'Reviews and ratings of recipes, created by the site’s users Files included with the dataset
What’s more, food is one of the rare things in life that a majority of people feel comfortable giving their opinion on, mostly because it is a common, human experience. This led me to wondering what factors drive ratings on websites like food.com, a question I’ve tried to explore while getting familiar with this dataset.
Data Cleaning and Exploratory Data Analysis
Original Files
Before pursuing this exploration, let’s take a look at the dataframes we have and the columns that constitute them.
-
RAW_recipes.csv| Column | Description | |:—————|:————————————————————————————————————————————————–| |
'name'| Recipe name | |'id'| Recipe ID | |'minutes'| Minutes to prepare recipe | |'contributor_id'| User ID who submitted this recipe | |'submitted'| Date recipe was submitted | |'tags'| Food.com tags for recipe | |'nutrition'| Nutrition information in the form [calories (#), total fat (PDV), sugar (PDV), sodium (PDV), protein (PDV), saturated fat (PDV), carbohydrates (PDV)]; PDV stands for “percentage of daily value” | |'n_steps'| Number of steps in recipe | |'steps'| Text for recipe steps, in order | |'description'| User-provided description -
RAW_interactions.csv
| Column | Description |
|---|---|
'user_id' |
User ID |
'recipe_id' |
Recipe ID |
'date' |
Date of interaction |
'rating' |
Rating given |
'review' |
Review text |
Comprehensive DataFrame
In order to consolidate the data and make the analysis process easier, we’ll use data from both files to make a single recipes dataframe that we’ll use going forward. We’ll group the reviews by recipe_id to get an average rating for these recipes, and incorporate that into the recipes dataframe by merging with the dataframe we created from RAW_recipes.csv.
Data Cleaning
After converting the nutrition column from list-appearing strings to proper lists, we’ll also break it up into 7 different columns for each of the nutrition facts, dropping the original nutrition column.
We’ll also convert the tags column from list-appearing strings to proper lists, but we’ll leave them grouped for the moment.
We replace every 0 rating with np.nan as to not sway the average ratings, as we believe that with 0 being the default rating, some of the recipes that get rated 0 were just reviewed by users that forgot to rate the recipe and not necessarily disliked.
Since the rating scale is supposed to be 1 to 5, we’ll set any rating greater than 5 (likely a result of an error at some point in the data pipeline) to 5. Similarly, we’ll set any recipe time in the minutes column that exceeds 1000 to the the value corresponding to the column’s 90th percentile as we still believe it is a long recipe but was probably written to include long fermentation times or other lengthy techniques that would sway the averages.
Exploration
Reminder
Our question was: “What drives ratings?”
Univariate Analysis
First, let’s see what the distribution for ratings looks like.
We can see that the distribution is top heavy, weighted more towards higher ratings. A reasonable explanation for this is that readers might be more inclined to leave a review if they enjoyed the recipe. Nevertheless, we might still be able to get some insight by analyzing what leads someone to leave a good review vs. an excellent one.
Bivariate Analysis
A reasonable expectation is that most people will enjoy easier, and consequently shorter, recipes more than a complex option. Let’s see if recipe length has any effect on the average rating.
It appears that it’s mostly the same for every length range, with the average rating hovering around 4.6/5 overall.
Assuming a large amount of readers are new to cooking, perhaps after a recent lifestyle change, we could look into nutritional values that may be sought out by certain groups. I chose to examine protein, as high protein content is sought out by a variety of people like athletes, college students, older people, etc…
We can observe a bit more variation, with a peak in the (2400,4400) range at a perfect 5, meaning that people might favor recipes with higher protein content.
Interesting Aggregates
I was curious to see if the contributor had any impact on the rating, identifying any potential recipe superstars. I grouped the recipes by contributor_id and averaged the ratings across their recipes, sorting by amount of recipes to see how the biggest contributors rank.
| contributor_id | count | mean |
|---|---|---|
| 37449 | 984 | 4.75 |
| 169430 | 756 | 4.81 |
| 5 | 671 | 5.00 |
| 386585 | 605 | 4.71 |
| 424680 | 604 | 4.77 |
| … | … | … |
| 178427 | 237 | 4.60 |
| 860079 | 228 | 4.76 |
| 315565 | 227 | 4.74 |
| 1329782 | 225 | 4.78 |
| 780172 | 223 | 4.67 |
Removing contributors with less than 200 recipes, we can see that maintaining a perfect average is much harder with large output. Although it seems like these ‘stars’ have a higher average than the ~4.6/5 we’ve observed elsewhere.
Popular tags were also an area of interest for me, so I decided to explode the tags column and analyze what tags were most popular and the number of recipes associated with them.
| Tags | Mean | Count |
|---|---|---|
| hidden-valley-ranch | 4.91 | 100 |
| non-alcoholic | 4.83 | 295 |
| simply-potatoes | 4.83 | 256 |
| avocado | 4.79 | 105 |
| punch | 4.78 | 267 |
| polynesian | 4.78 | 134 |
| ramadan | 4.78 | 120 |
| scottish | 4.78 | 183 |
| moroccan | 4.76 | 414 |
| gelatin | 4.76 | 146 |
| swiss | 4.76 | 216 |
| independence-day | 4.75 | 339 |
| sweet-sauces | 4.75 | 246 |
| stocks | 4.74 | 171 |
| herb-and-spice-mixes | 4.74 | 194 |
| grilling | 4.74 | 1252 |
| beverages | 4.74 | 4461 |
| strawberries | 4.74 | 651 |
| mango | 4.74 | 259 |
| smoothies | 4.74 | 778 |
| cocktails | 4.74 | 1788 |
| lettuces | 4.73 | 328 |
| broil | 4.73 | 231 |
| barbecue | 4.73 | 965 |
| frozen-desserts | 4.72 | 546 |
| greek | 4.72 | 952 |
| cooking-mixes | 4.72 | 241 |
| bacon | 4.72 | 620 |
| shakes | 4.72 | 267 |
| melons | 4.72 | 185 |
It seems like Hidden Valley ranch is a an overwhelming favorite, while other popular tags include cuisine names, ingredients and holidays/religious observances (Moroccan made the list which, while it has no influence on my analysis, is huge for the program).
Prediction Problem
Regression to Predict Protein Content
This section details the model used to predict whether a recipe is high or low in protein content. This is framed as a binary classification problem, where the target variable indicates whether a recipe’s protein content surpasses a predefined threshold (the median protein content in the dataset)
Baseline Model
Model Selection and Rationale:
Given the nature of the problem (binary classification), a Logistic Regression model was selected as a baseline. Logistic Regression, being a linear model, offers interpretability and computational efficiency, making it suitable for initial exploration and baseline performance assessment. Given the potential for class imbalances, we used a OneVsRestClassifier which trains a separate binary classifier for each class (high and low protein) and incorporates class_weight='balanced' to weigh the classes in proportion to their representation in the training dataset. The solver was set to liblinear to help prevent the issue of infinite loops. A maximum iteration limit of 10,000 was also used (max_iter = 10000).
Feature Engineering and Selection:
The features used for prediction include:
- Quantitative Features:
carbohydratesandtotal_fat(2
Model Pipeline:
To streamline the model building process, a pipeline was employed which incorporates the following steps:
- Data Preprocessing: A
ColumnTransformeris utilized to apply theStandardScalerto the numerical features (carbohydratesandtotal_fat). - Model Training: A
OneVsRestClassifierwrapper was used to train a logistic regression model that handles binary classification problems.
Model Evaluation:
The model’s performance is evaluated using the following metrics:
- F1-score: A balanced measure considering both precision and recall, particularly important in addressing potential class imbalances.
- Accuracy: The overall correctness of the model’s predictions.
- Confusion Matrix: A visual representation of the model’s performance, showing the counts of true positives, true negatives, false positives, and false negatives.
- Classification Report: Detailed breakdown of precision, recall, F1-score, and support for each class (high and low protein).
Model Performance Results:
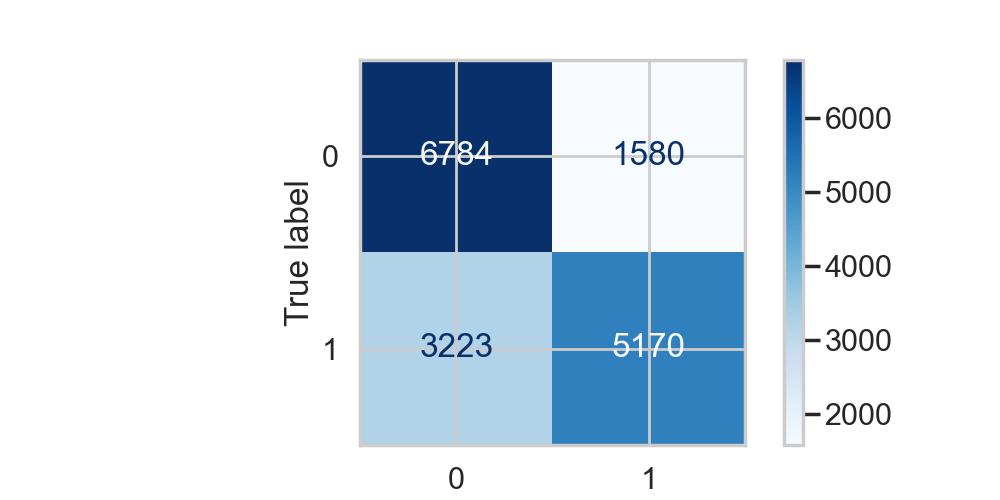
The model achieves the following performance metrics:
- F1-score: 0.68
- Accuracy: 0.71
Confusion Matrix:

Final Model
This section details the final model developed to predict high versus low protein content in recipes, building upon the baseline model’s foundation. The goal was to improve predictive accuracy while addressing potential limitations of the baseline model, such as its inability to capture non-linear relationships between features.
Model Selection and Rationale:
A RandomForestClassifier was selected for the final model. Random Forests handle non-linear relationships well and are less prone to overfitting than a single linear model.
Feature Engineering:
Two new features were engineered to improve predictive accuracy:
carbohydrate_ratio: (carbohydrates) / (carbohydrates + total_fat + protein)fat_protein_ratio: total_fat / protein (handled division by zero)
Model Pipeline:
The final model utilizes a pipeline that incorporates:
- Data Preprocessing:
StandardScaleris applied to the numerical features. - Model Training: A
RandomForestClassifieris trained, with hyperparameters tuned usingGridSearchCV.
Hyperparameter Tuning:
GridSearchCV was used to optimize the following hyperparameters:
max_depthmin_samples_splitn_estimators
The best hyperparameters were selected by maximizing the F1-score using 3-fold cross-validation.
Best Hyperparameters: {'classifier__max_depth': None, 'classifier__min_samples_split': 5, 'classifier__n_estimators': 100}
Model Performance Results:
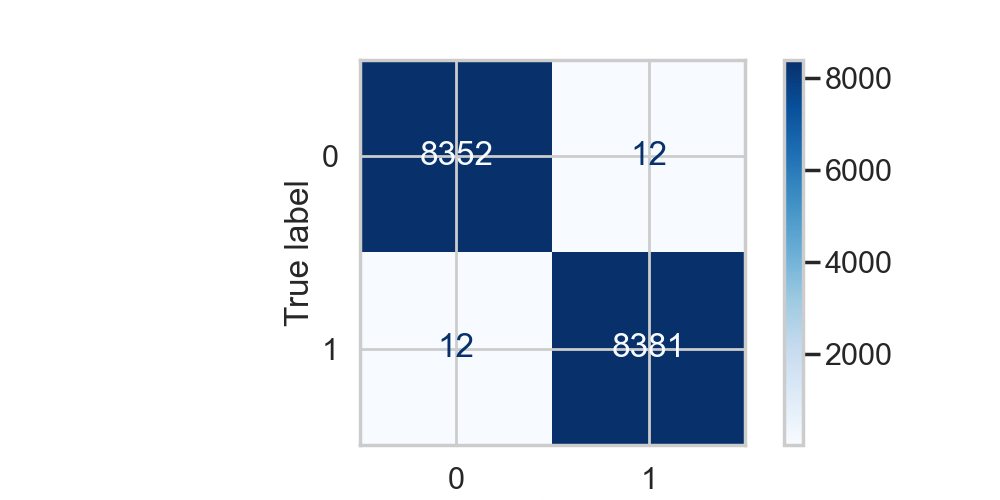
The final model demonstrates a significant improvement over the baseline:
- F1-score: 0.9986
- Accuracy: 0.9986
Confusion Matrix:

Model Assessment
The final model exhibits exceptionally high performance. This improvement over the baseline suggests that the engineered features capture important non-linear relationships and that the RandomForestClassifier is well-suited to this task. However, the near-perfect scores warrant further investigation to rule out overfitting. The confusion matrix (included below) provides a visual representation of the model’s performance.